
The Big Picture - Navigating Risk
The very big picture:
In the "decades" timeframe, the current Secular Bull Market could turn out to be among the shorter Secular Bull markets on record. This is because of the long-term valuation of the market which, after only eight years, has reached the upper end of its normal range.
The long-term valuation of the market is commonly measured by the Cyclically Adjusted Price to Earnings ratio, or “CAPE”, which smooths out shorter-term earnings swings in order to get a longer-term assessment of market valuation. A CAPE level of 30 is considered to be the upper end of the normal range, and the level at which further PE-ratio expansion comes to a halt (meaning that increases in market prices only occur in a general response to earnings increases, instead of rising “just because”).
Of course, a “mania” could come along and drive prices higher – much higher, even – and for some years to come. Manias occur when valuation no longer seems to matter, and caution is thrown completely to the wind as buyers rush in to buy first and ask questions later. Two manias in the last century – the 1920’s “Roaring Twenties” and the 1990’s “Tech Bubble” – show that the sky is the limit when common sense is overcome by a blind desire to buy. But, of course, the piper must be paid and the following decade or two are spent in Secular Bear Markets, giving most or all of the mania gains back.
See Fig. 1 for the 124-year view of Secular Bulls and Bears. The CAPE is now at 35.28. This value is in the lower end of the “mania” range. Since 1881, the average annual return for all ten year periods that began with a CAPE between 30 - 40 is -0.3%. (see Fig. 2).
1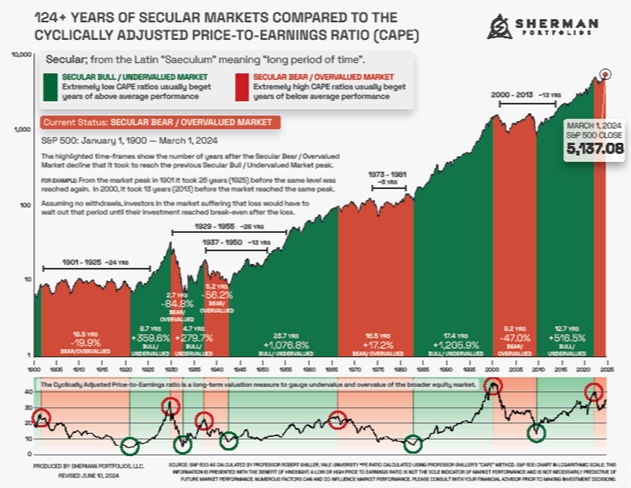
2